
Overview
Skillways Progress provides a robust vehicle for capturing data generated through mapping outcomes and skills to activities that demonstrate learner competency. This guide will provide an overview of the progress feature.
Go to Progress.
Select the progress graph icon in the upper right corner.

A new window will appear defaulting to Grader view. From here, you can select whether to view data and student performance through the Activity View or the Outcome View.
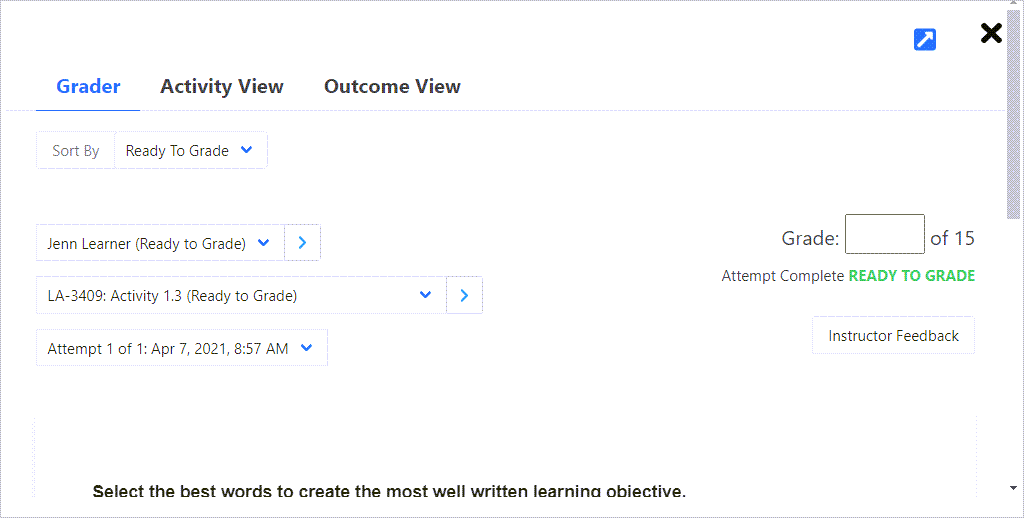
Activity View
Select the Activity View tab.
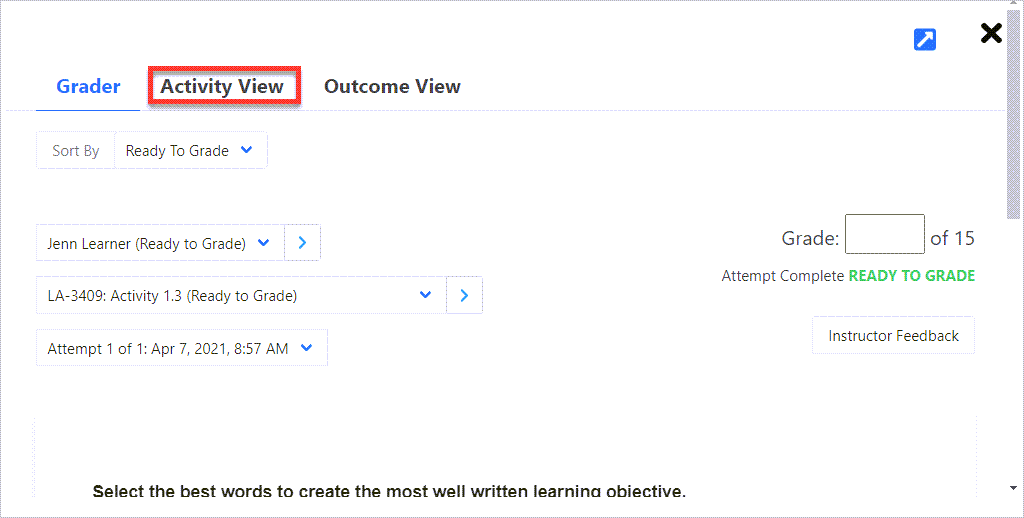
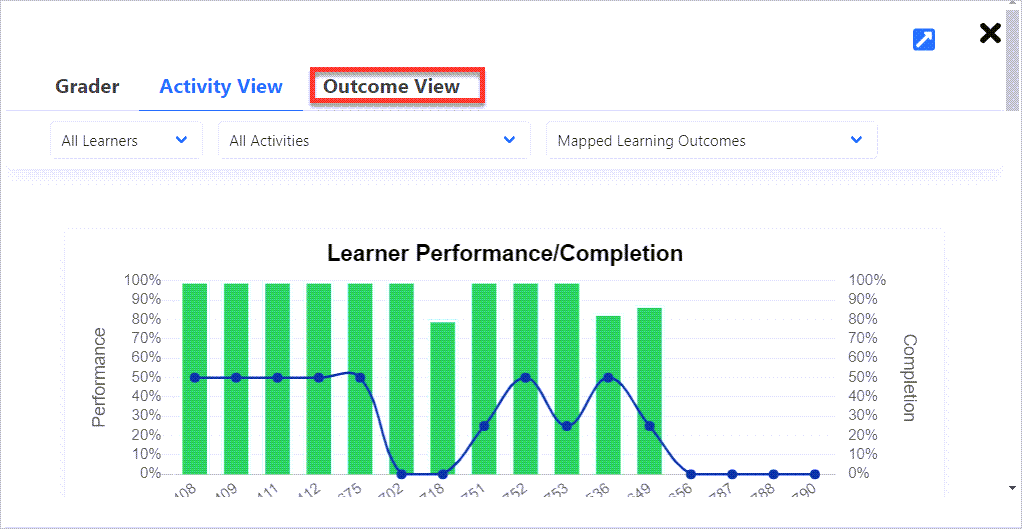
The Activity View provides an overview of learner performance (green bar graph) and completion of activities (blue line graph).
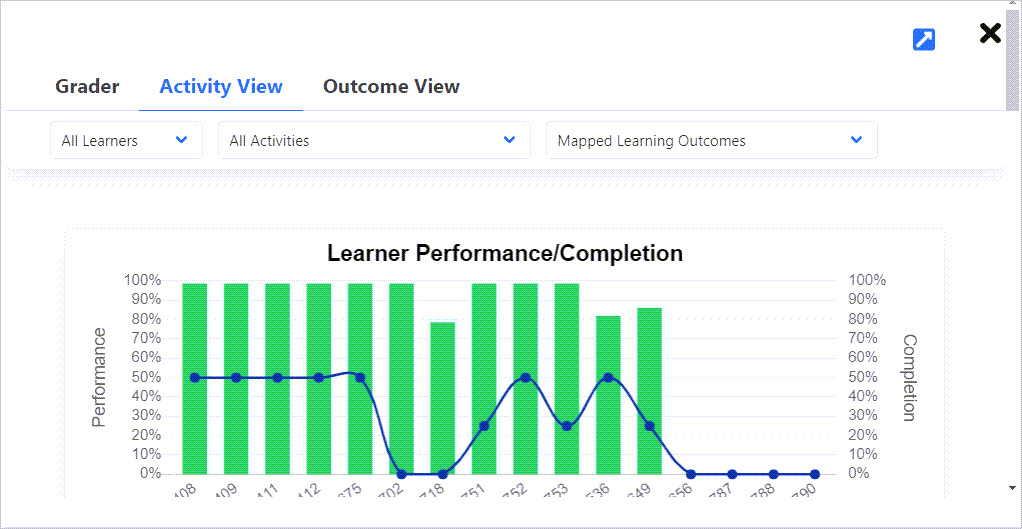
This view can show all learners.

Or you can choose a specific learner from the drop-down menu.
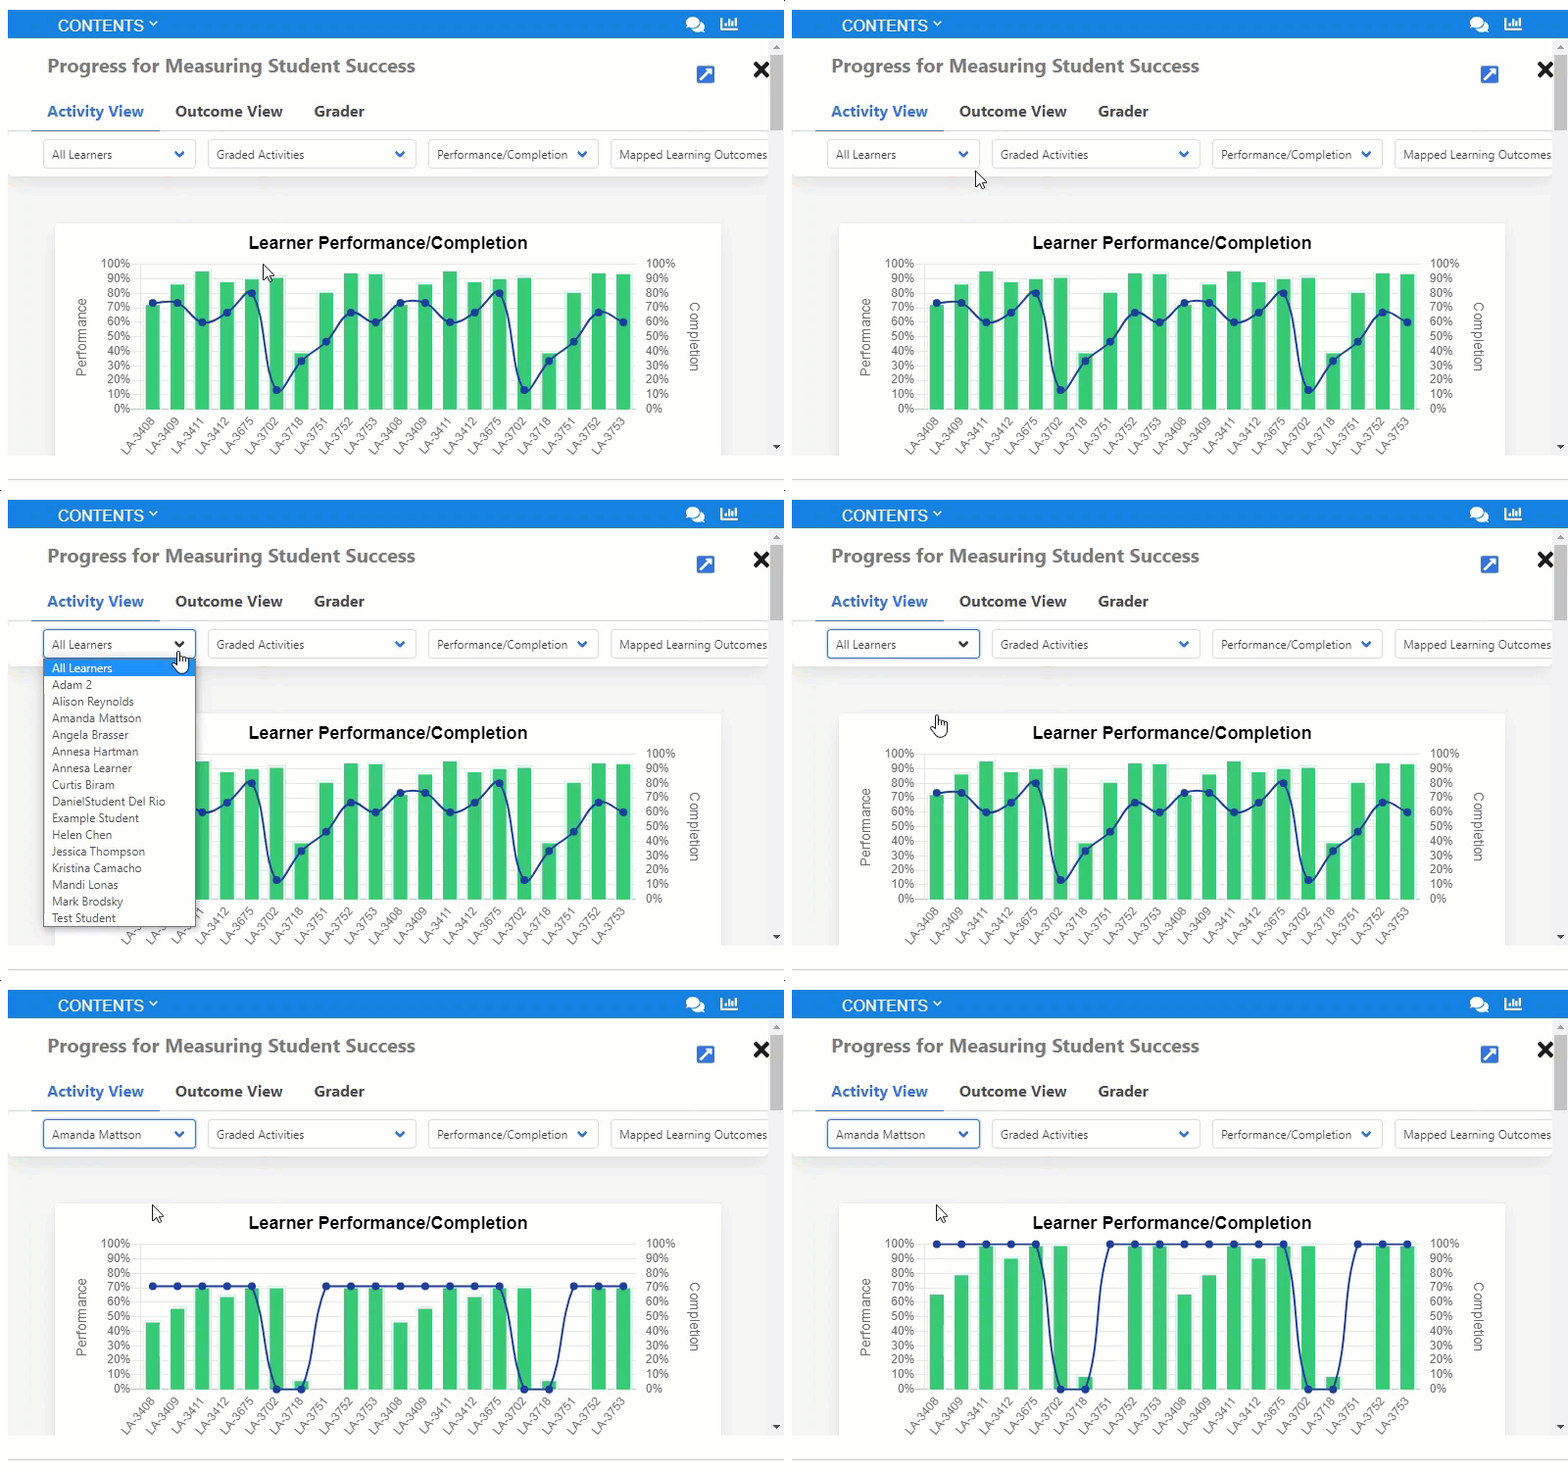
In Activity View, you can see all graded activities.
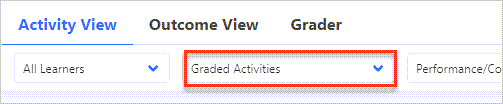
Or you can choose activities from the drop-down menu.

Lower Section of Progress
In Activity View, the lower section of Progress shows the information from the upper section by Learning Path, Learners, and Activities.
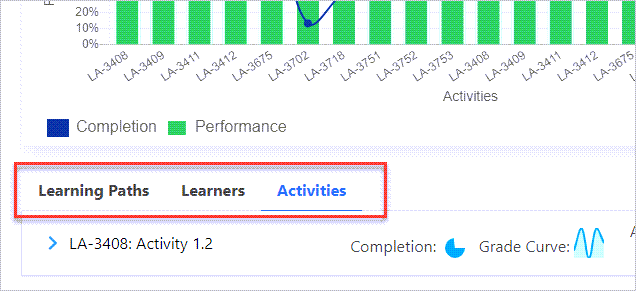
Select Learning Paths to display all learning paths (modules, units, etc.) in your course.
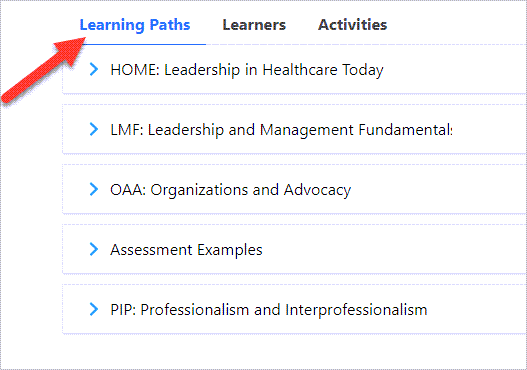
Select the Arrow next to a Learning Path to display activities within the learning path.
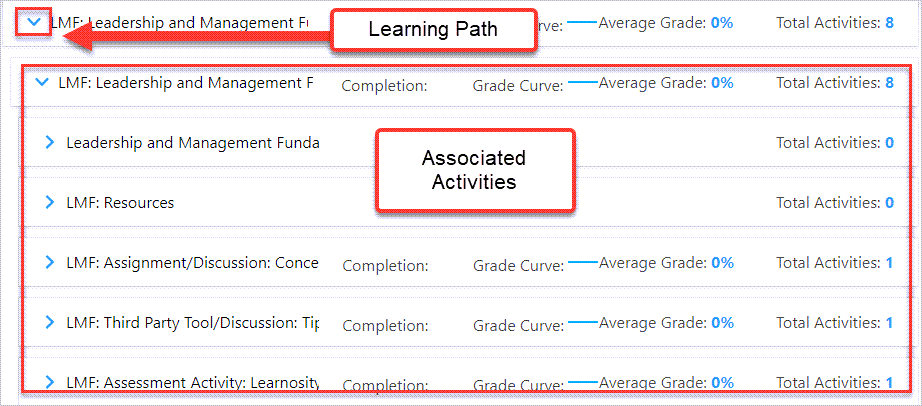
Select an Arrow next to an activity.
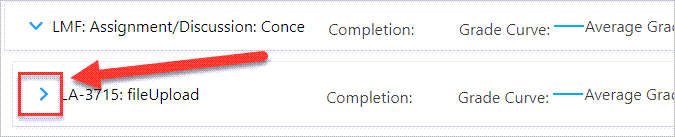
This will provide the ability to see learning outcomes, learner completion of the activity, grade curve, and average grade. Grader can be accessed from here as well by clicking on the Grade button.

Select the Learners tab.

This will list each of the learners and a high level view of completion and average grade.
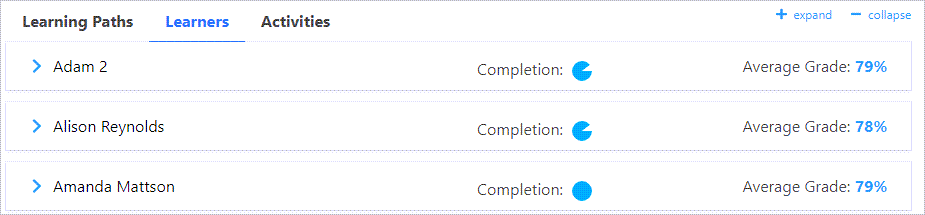
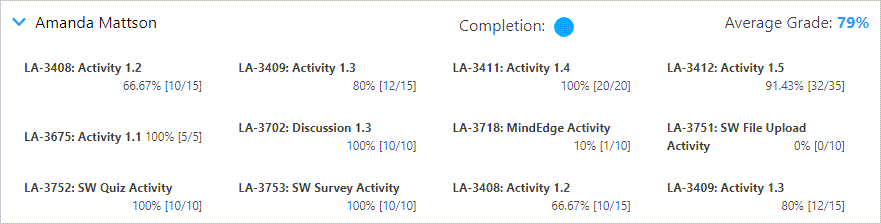
Select a learner using the arrow.

Under the learner's name you will see their performance on each activity and whether they have completed it.
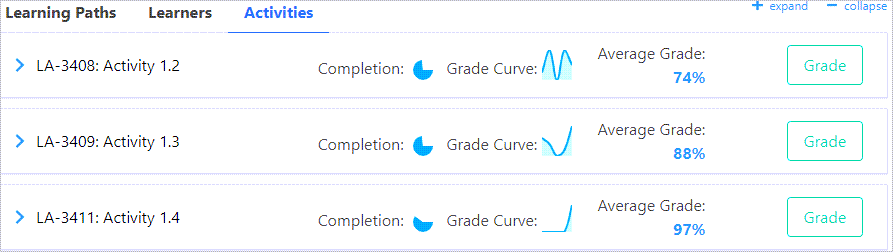
Select the Activities tab.

This will display learner completion, grade curve, and average grade per activity. In addition, the Grade button allows you to grade the activity. See our user guide on How do I grade in Skillways for more information on grading.
Outcome View
If outcomes are used in your course, the Outcome View provides a heat map of learner performance by achievement level and completion in relation to the learning outcomes.
Select Outcome View to view the heat map.
A new screen will appear. Learner performance related to outcomes is indicated by the colors of the boxes and completion is indicated by the size of the squares.
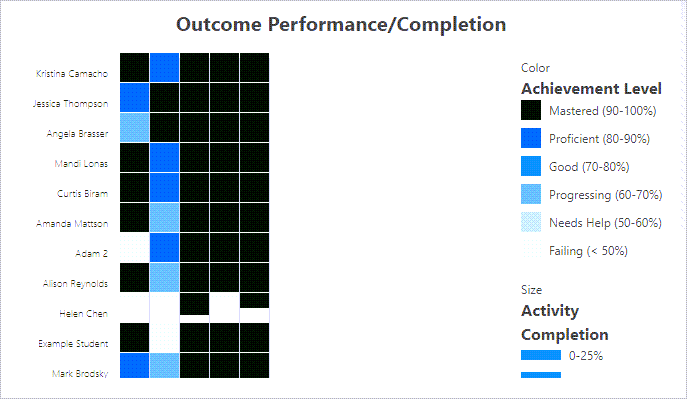
See the example below where students at the bottom are struggling to meet learning outcomes 1-5.

Like Activity View, in Outcome View, you can view all learners or just specific learners. In addition, you can view all activities or specific activities.

Lower Section of Progress in Outcome View
In Outcome View, you can scroll down and select Learners and Activities and reveal the same information as in Activity View. However, instead of Learning Path, there is a Learning Outcomes tab.
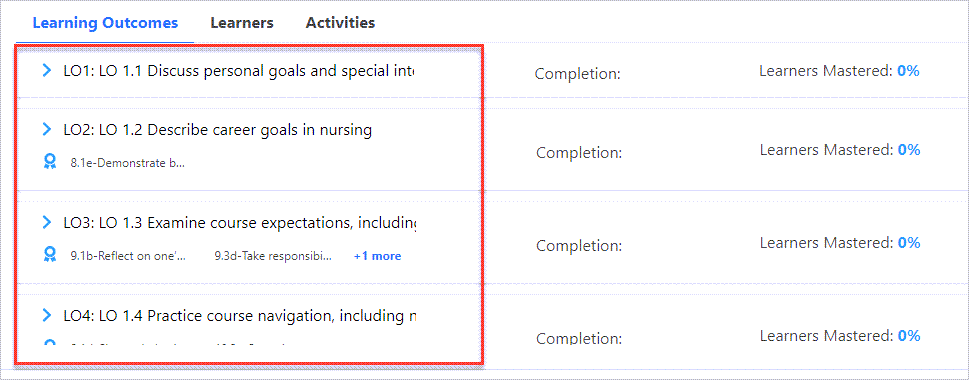
Click on Learning Outcomes.

A list of the Learning Outcomes in the learning path will display along with any associated credentials or skills.
This view provides a high level overview of completion, mastery, and total activities mapped to the outcome.
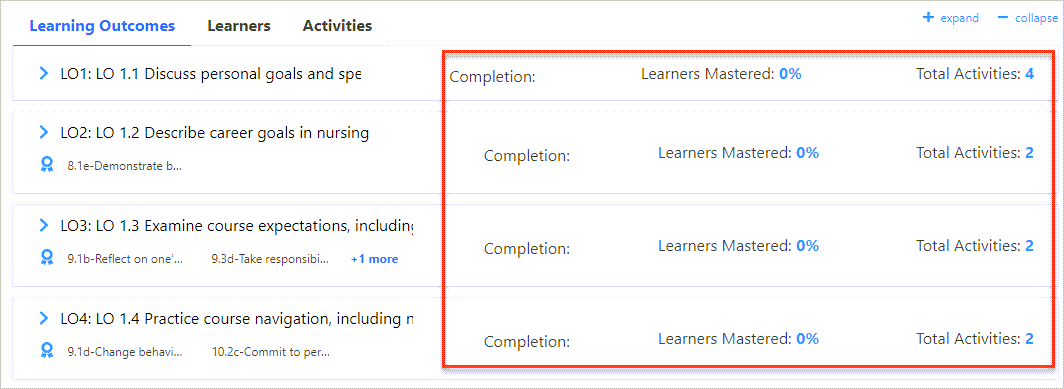
Select an outcome.
This will show overall completion, grade curve, and average grade for all activities associated with that outcome.

You can also Grade from here. See our user guide on How do I grade in Skillways for more information on grading.

Comments
0 comments
Please sign in to leave a comment.